Featured Image from: The New York Times
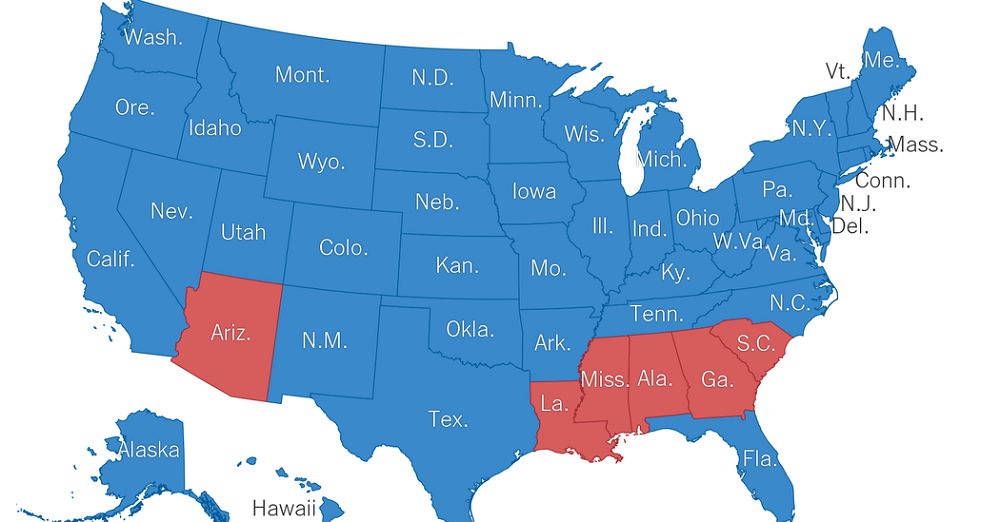
Most of you are probably familiar with this el;ectoral map by now. The good old red states and blue states and as you are probably aware if you zoom in past the state boundaries, what you’ll find is that the red and blue divide is actually much more pronounced from County to County rather than between the states themselves.
This reflects an increasing trend that has been going on for decades now. In 1976 roughly twenty eight percent of voters lived in what are called landslide counties. In 2012 that number increased to about 50% and now in 2016 60% of voters live in landslide counties. That’s over double the amount from just forty years ago and this divide is even more extreme in big cities and especially rural and remote areas.
So when it comes to voting for one of the two major parties, there does seem to be a growing Geographic divide. But what about our beliefs and values is there an ideological divide as well?
In 1994 the Pew Research Center began a survey where they asked a large sample group of Americans 10 ideological questions to determine their political values and then rank them on a scale of consistently liberal to consistently conservative.
This chart shows the results from 1994 the blue represents the Democrats and the red is Republicans as you can see there’s some red and blue areas off to the sides but there is a large overlapping region in the middle. As time goes on you could see the red and blue blobs shift along the spectrum and for some reason and the decade or so the two blobs have very noticeably drifted apart. The Blues have become bluer the Reds redder and the moderate overlapping part has shrunk significantly.
Another study by the Pew Research Center found that in 2016 58% of Republicans have a very unfavorable impression of the Democratic Party. Up from 46% in 2014 and just 32% in 2008. The Democrats have followed a similar trajectory over the years. Currently 55% find Republicans very unfavorable. What’seven more alarming though is that the same study found that 45% of Republicans and 41% of Democrats actually see the other side as a threat to the nation’swell-being.
This is a sharp increase even from just two years ago. so what’s actually going on here what’s with all the distrust and animosity?
Well, interestingly enough despite the fact that voters allegiances to their parties seems strong, there’s a lot of evidence to suggest that people are fed up with the whole system. A recent poll by JenFord showed that only 28% of young adults overall feel that the two major parties do a good job of representing the American people.And there’s been a sharp increase over the past few years of people who identify as independents.
But if Americans are so unified in their dissatisfaction with politics then how do we explain this? Well, let’s take a look at how this chart was created.